


SPX gamma gets most of the attention, while VIX gamma tends to be overlooked. Our new tool shows the current level of VIX dealer gamma and how often those levels have preceded volatility spikes.
We built it the same way we build every tool on the platform: Only after backtesting confirmed it delivers a measurable edge.
Every VIX option has a dealer on the opposite side of the trade. Dealers hedge their exposure as the VIX moves, and their gamma exposure (GEX) measures how much hedging pressure that positioning creates.
When dealers hold high levels of gamma, these flows can meaningfully influence how the VIX moves. When gamma exposure is low, that influence is largely absent.
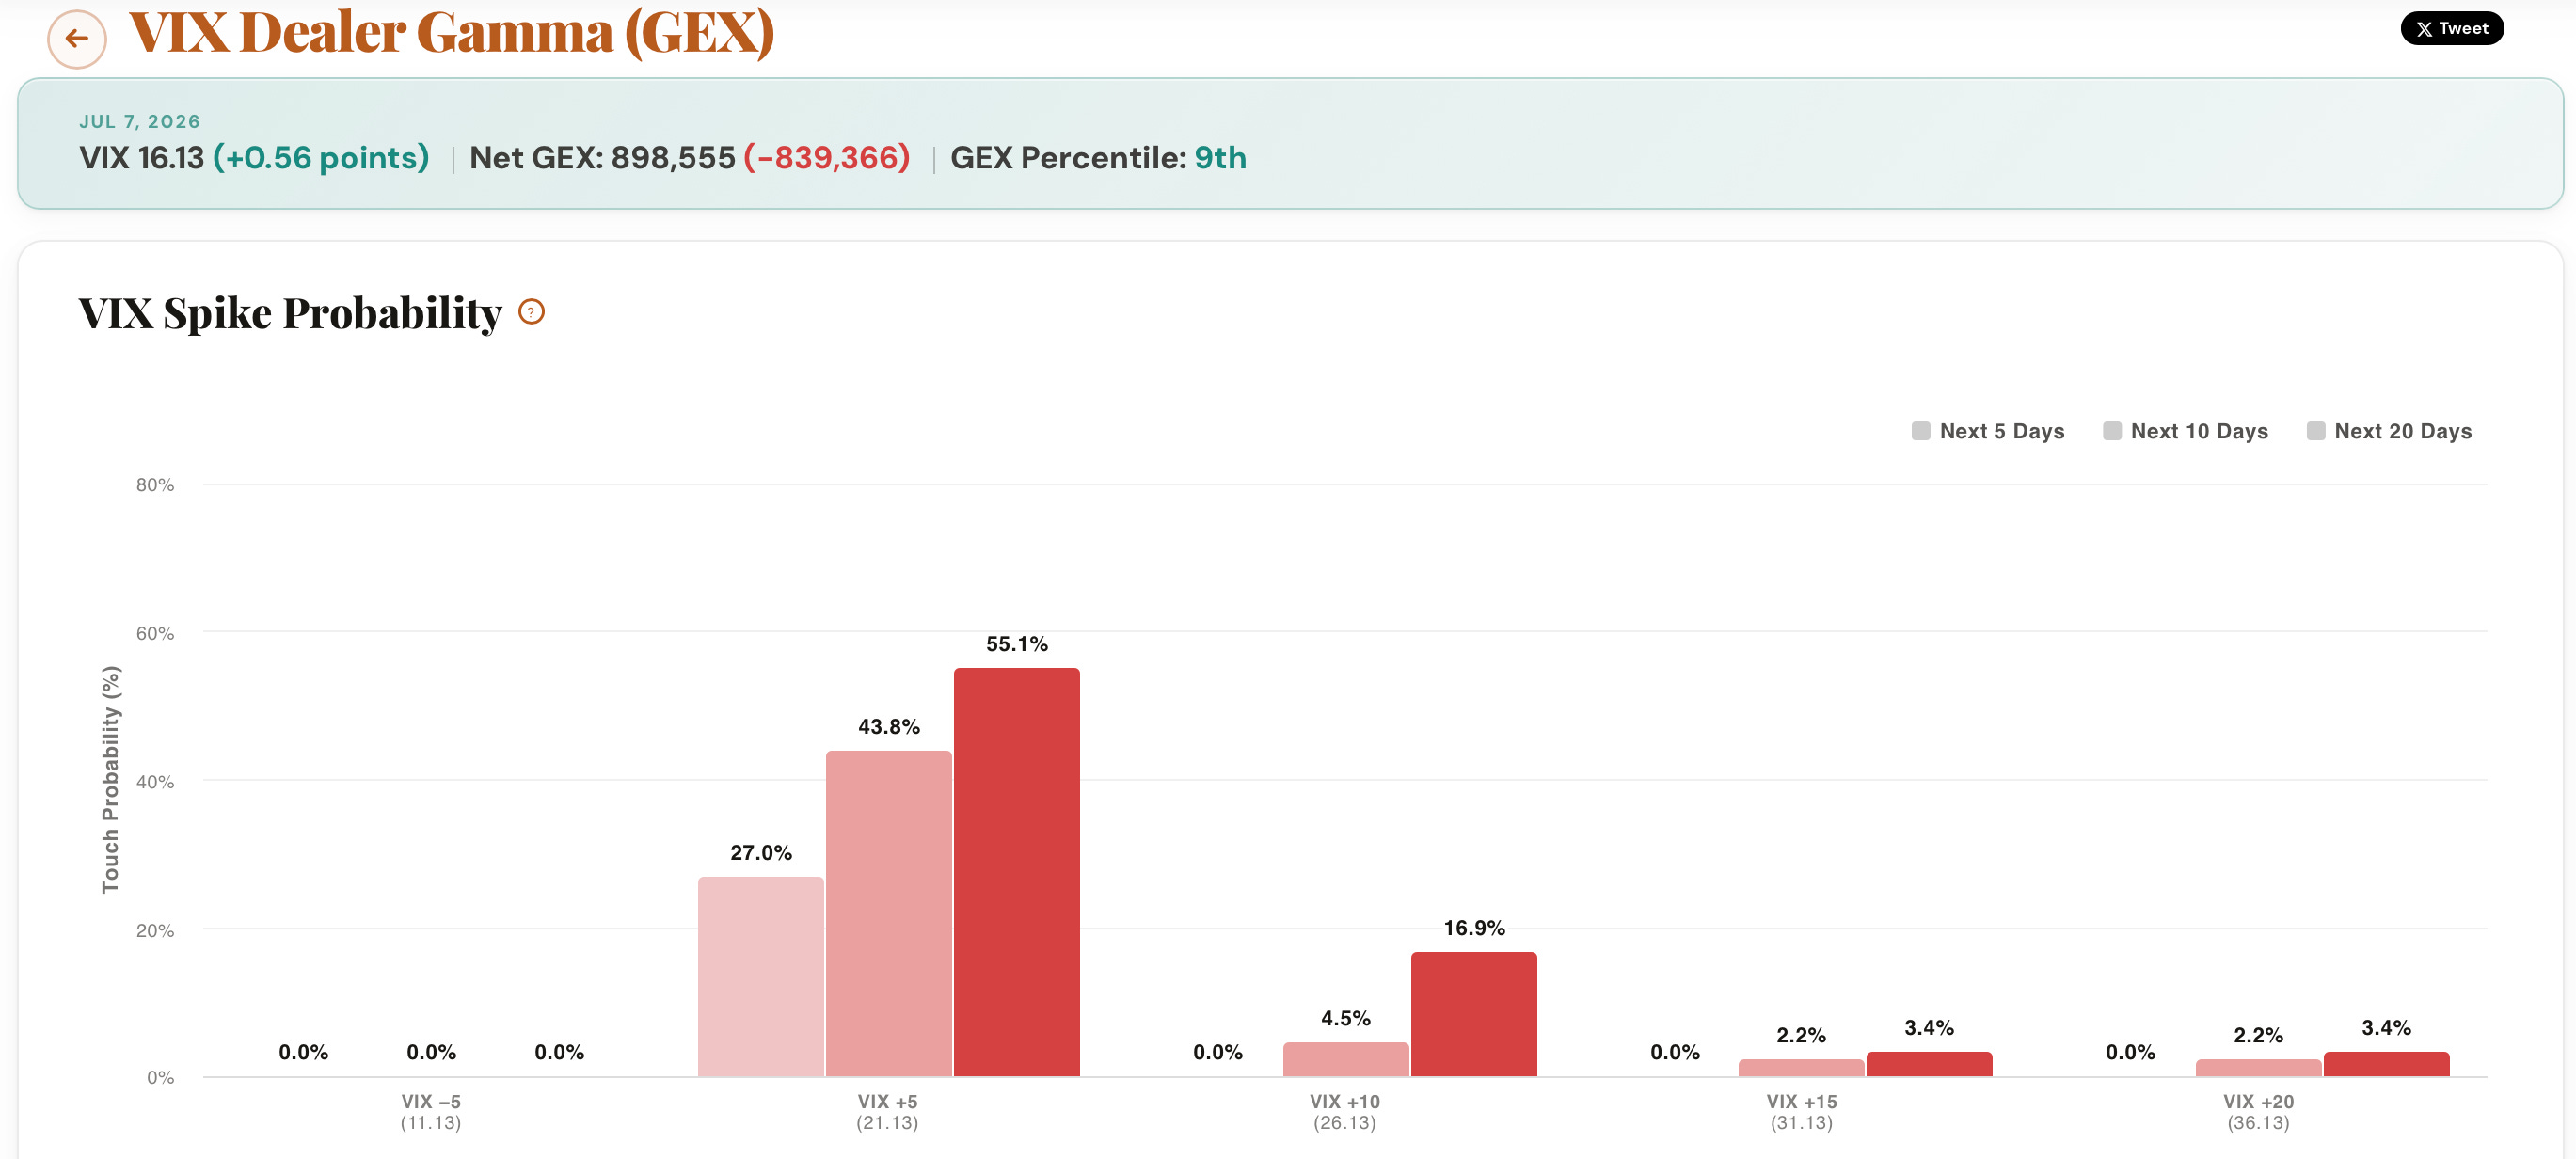
Rather than a raw figure that is hard to compare over time, the tool shows dealer gamma as a percentile of its own trailing 6-month range. A reading near 100 means positioning is heavy relative to recent months, and a reading near 0 means it is light. It also separates calm markets from stressed ones, because the same reading can carry a different meaning when the VIX is already elevated.
From there, the tool finds every past day when dealer gamma sat at a similar percentile in the same VIX regime, and shows what the VIX did next. You get the probability the VIX reaches each level over the next 5, 10, and 20 trading days, a chart of those odds, and a log of every comparable day.